Getting Started with dbViZ
Table of Contents
Introduction
This guide will introduce you to some of dbViZ's many
features. It describes the user interface and creating and editing diagrams. To
follow it, you must have already installed dbViZ. You should also be
familiar with common relational database terms, such as "SQL", "schema",
"column" and "foreign key".
Starting a new diagram
The whole point of dbViZ is to create diagrams for
existing database schemas; it doesn't help you define new schemas or
modify existing schemas. At the time of this writing, schema information can be
"imported" from an Oracle database or a "SQL File", a file that contains SQL create table statements. We plan to add more databases to this list in the
future.
Let's walk through the process by loading one of the sample
schemas that come with dbViZ.
- First, start up dbViZ. After it's finished loading, you'll see
the main window.
- Click File in the menu bar at the top, and then Import
Schema... The Schema Import dialog will now open, allowing you to choose
where you'll get the database schema for your diagram.
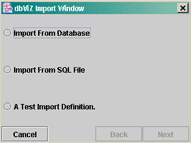
- For this example, we'll choose to import from a SQL file,
because we've packaged several sample schemas in SQL files; it's a lot harder
to make Oracle schemas available to everyone. Click the Next
button.
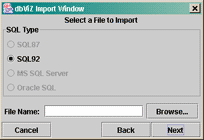
- Now you'll see the panel for SQL file importing. It's pretty simple
in that you only need to choose a SQL file to import. Click on the
Browse... button to open a file-chooser dialog.
- The file-chooser dialog will list the files in your
dbViZ/bin directory;
there are several SQL files included. Click on FDC2.sql and then
Open. The file-chooser window will disappear, returning to the SQL
import panel.
- The file you chose is now listed in the File Name text box.
Click the Next button to finish the sequence. The import dialog will
disappear, and dbViZ will import the schema described in the SQL
file.
The dbViZ interface
Now that we have a schema imported, we can describe the various
functions in the main dbViZ window. The main portions of the window are
denoted below:
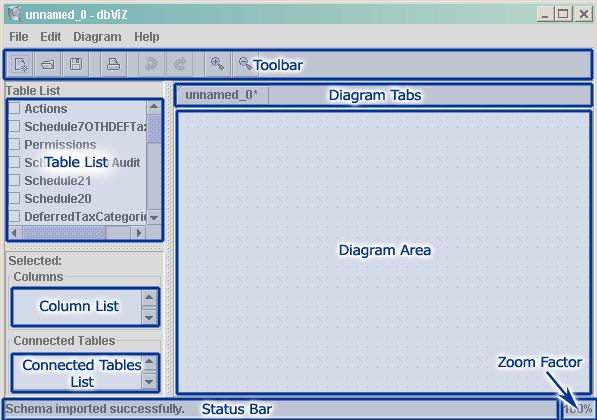
- Toolbar
- The toolbar contains buttons for frequently-used options.
- Diagram Tabs
- dbViZ can open multiple diagrams simultaneously. The Diagram
Tabs area lists the open diagrams for easy switching between them.
- Diagram Area
- This is where the diagram is shown. You can move and resize tables
and reroute lines so diagrams convey are easier to understand.
- Table List
- The table list shows all the tables in the diagram's schema. The
checkbox beside the table name shows whether that table is in the diagram, and
allows you to add and remove tables from the diagram with a single click. You
can choose exactly which tables to show in your diagrams so it conveys just the
right amount of information for your needs.
Table selections are
synchronized between the diagram area and table list, so selecting a table in
the table list will select the table in the diagram, and vice versa.
- Column List
- When one table is selected, the Column List will show the columns for
that table, and whether the columns are drawn in the diagram. An icon of a
key
 denotes that the column is a primary key of
that table. In the same way you can choose which tables are drawn, by clicking
the checkboxes beside the column names, you can choose which columns in each
table are shown in the diagram.
- Connected Tables List
- A big challenge in creating diagrams with an unfamiliar schema is
figuring out which tables have foreign key links. dbViZ makes this task
easy with the Connected Tables List. When a single table is selected, this list
shows all the tables that are "connected" to this table. Once again, we use
checkboxes to show whether the tables are in the diagram, and so you can add
the tables with a single click. Instead of deciphering the database metadata by
hand, you can explore the schema and grow your diagrams by their
connections.
A double-arrow (» or «) in front
of each table name denotes whether the connected table is the independent table
(it has the primary key) or a dependent table (it has the foreign key),
respectively.
- Status Bar
- This section shows various application messages.
- Zoom Factor
- This displays the current zoom factor in percent.
"Growing" a diagram
Next, we'll walk through an example of how dbViZ lets
you simultaneously explore and create a diagram.
- We'll continue with the schema we imported from "FDC2.sql" (described
in Starting a new diagram).
- Find the table "Schedule20" in the Table List on the left. Click its
checkbox and the table will appear in the Diagram Area. Its primary key column,
"schedule20seq" is shown by default.
- In the Diagram Area, click-and-drag the table to the right side of
the diagram with the left mouse button.
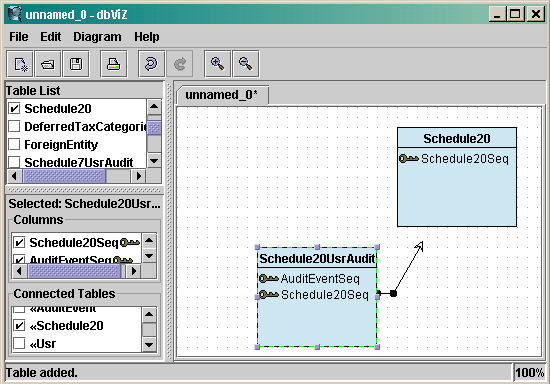
- Look at the Connected Tables List in the lower left and add the
"Schedule20UsrAudit" table by clicking its checkbox. The table is added to the
diagram, and an arrow is automatically drawn from Schedule20UsrAudit's
Schedule20Seq column to the Schedule20 table. This indicates that the
Schedule20Seq column is a foreign key that references the primary key of
Schedule20!
We'll explain why it has that funny black dot on the line
with the next steps. First, though, drag the Schedule20UsrAudit table down near
the bottom of the diagram.
- Let's add another table! Click on the Schedule20 table, either in the
Diagram Area or the Table List. In the Connected Tables List, find the
ForeignEntity table and click its checkbox to add it to the diagram.
The
table appears with another arrow drawn, this time showing that Schedule20 has a
foreign key column that references the ForeignEntity table's primary key.
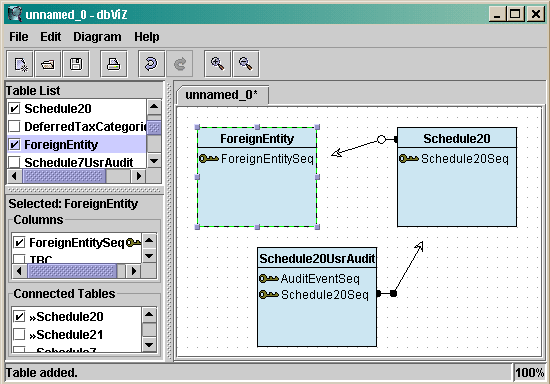
- Note, that the arrow is drawn from the Schedule20 table name, and it
has a hollow (white) circle instead of a solid dot. This is telling you two
things:
- The arrow is starting from the table name because the foreign key
column isn't currently shown in the diagram. Usually, dbViZ draws the
arrow starting from the column name. Obviously, it can't draw the arrow from a
column that isn't shown.
- The dot is hollow because not all of the foreign key columns are
shown. In this case, there happens to only be one column in the foreign key
connection. The dot is good when you have multiple primary key columns, because
it'll indicate when you probably should show more columns in the table. At the
least, it'll warn those who're looking at the diagram that some information for
the connection is hidden.
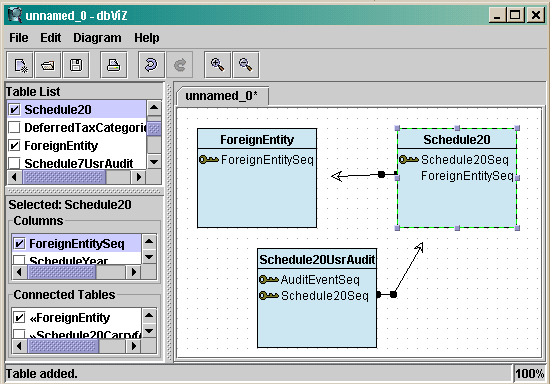
- Showing a connection without all the information can be dangerous, so
let's show the foreign key column. Click on the Schedule20 table to select it.
Then, in the Column List (on the left side, between the Table List and the
Connected Table List), click the checkbox beside
ForeignEntitySeq.
Schedule20's ForeignEntitySeq column is now drawn,
with the arrow redrawn to start from that column. The dot is also now
solid--all of the connection's information is now shown.
Helpful Hints
There are many handy features that we haven't discussed in this
guide. Below are some of the other features.
- You can manually reroute where the lines go. Click on the line
segments with the right mouse button to add and remove points. Move points by
dragging with the left mouse button.
- In this guide, we manually moved the tables around since they always
appear in the top-left area of the diagram. If you want to add a bunch of
tables without messing much with where they appear, turn on the
Auto-Arrange mode. It's in the Edit menu. When you're in Auto-Arrange
mode, dbViZ will automatically arrange the tables, trying to minimize
line crossings. However, you won't be able to manually move tables around in
this mode. If you want control of table placement again, just turn off
Auto-Arrange mode.
- If you happen to have a mouse with one of those spiffy scroll wheels,
you can use it to zoom in and out easily.
Copyright © 2003 The dbViZ Group.
All Rights Reserved.


